
The graph given below represents which of the following function?
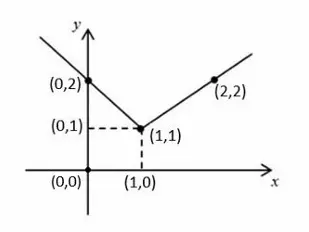
The graph given below represents which of the following function?
Solution
✅ Correct Option: 3
The graph shows a V-shaped curve, which is characteristic of an absolute value function.
The vertex is the lowest point where the two lines meet.
From the graph, the vertex is at the point .
For any absolute value function in the form , the vertex is at the point .
In this form:
- moves the graph left or right
- moves the graph up or down
Since the vertex is at :
Substituting into the formula:
The sign inside the absolute value is opposite to the vertex location:
- has vertex at (moves right)
- has vertex at (moves left)
This is because gives .
Therefore, the answer is
Related questions:
2025: 16 May Shift 1
2026: 18 May Shift 1