
As per the graph given below:
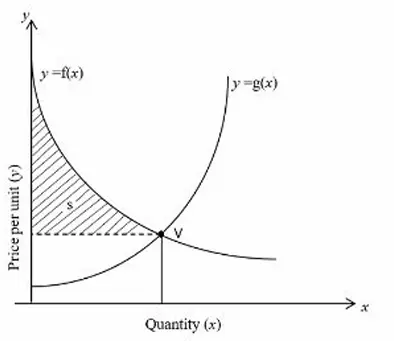
Match List-I with List-II
List-I List-II (Function/Area/point) (Representation) (A) Consumers Surplus (I) y=g(x) (B) Supply function (II) v (C) Demand function (III) s (D) Equilibrium point (IV) y=f(x)
Choose the correct answer from the options given below:
As per the graph given below:
Match List-I with List-II
| List-I | List-II |
|---|---|
| (Function/Area/point) | (Representation) |
| (A) Consumers Surplus | (I) y=g(x) |
| (B) Supply function | (II) v |
| (C) Demand function | (III) s |
| (D) Equilibrium point | (IV) y=f(x) |
Choose the correct answer from the options given below:
Solution
In a supply-demand graph, the demand function shows how much customers want to buy at different prices. When price increases, people buy less, creating a downward sloping curve, typically labeled as .
The supply function shows how much sellers want to sell at different prices. When price increases, sellers supply more, creating an upward sloping curve, typically labeled as .
The equilibrium point is where the supply and demand curves intersect, representing where supply equals demand. This is marked as a point on the graph.
Consumer surplus is the triangular area between the demand curve and the equilibrium price, representing the benefit consumers receive.
Matching List-I with List-II:
(A) Consumer Surplus is an area, represented by region
Therefore, (A) matches with (III)
(B) Supply Function is an upward sloping function, represented by the equation
Therefore, (B) matches with (I)
(C) Demand Function is a downward sloping function, represented by the equation
Therefore, (C) matches with (IV)
(D) Equilibrium Point is where the curves meet, marked as point
Therefore, (D) matches with (II)
The correct answer is: (A) - (III), (B) - (I), (C) - (IV), (D) - (II)
Related questions:
2026: 12 May Shift 2
2025: 21 May Shift 1
2026: 22 May Shift 1