
Which of the following regions will represent the shaded area in the given figure ?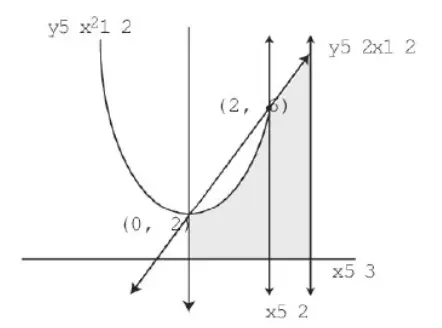
Which of the following regions will represent the shaded area in the given figure ?
Solution
✅ Correct Option: 1
1. Identify the Core Equations from the Figure:
- The Parabola: The label says
y 5 x^2 1 2, which translates to the quadratic curve: (with its vertex at ). - The Straight Line: The label reads
y 5 2x 1 2, which translates to the linear equation: . - Vertical Boundary Lines: There are two vertical lines drawn at
x 5 2andx 5 3, meaning and .
2. Analyze the Shaded Region:
Let's look at where the shaded area lies relative to each boundary:
- With respect to the X-axis (): The shaded region lies entirely above the x-axis, meaning .
- With respect to the Parabola (): The shaded area lies below the curve of the parabola for its entire span. Therefore, the inequality must be .
- With respect to the Line (): The shaded area lies below the straight line. Therefore, the inequality must be .
- With respect to the X-interval: The region starts at the y-axis () and extends all the way to the final vertical line boundary at . This means .
Conclusion:
Combining all these boundaries, the system of inequalities that represents the shaded region is:
This corresponds exactly to Option 1.
Related questions:
2025: 30 May Shift 1
2026: 26 May Shift 2
2026: 29 May Shift 2
2026: 21 May Shift 2
2026: 30 May Shift 2
2026: 19 May Shift 2