
In the below mentioned demand supply curve , identify the equilibrium point
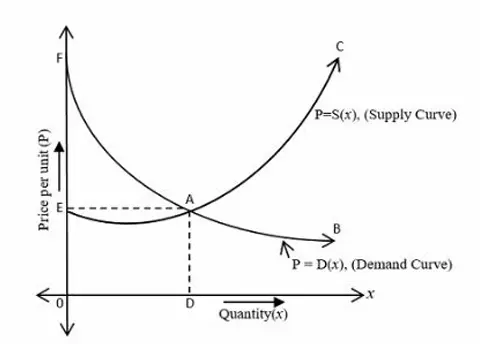
In the below mentioned demand supply curve , identify the equilibrium point
Solution
The equilibrium point is where the demand curve and supply curve intersect. At this point, the quantity demanded equals the quantity supplied, resulting in no shortage or surplus.
In a demand-supply graph:
The demand curve slopes downward from top-left to bottom-right, showing that when price decreases, quantity demanded increases.
The supply curve slopes upward from bottom-left to top-right, showing that when price increases, quantity supplied increases.
The equilibrium point is the exact spot where these two lines cross.
From the given diagram:
Point A is where the two curves intersect.
Point B is on one of the curves but not at the intersection.
Point C is on one of the curves but not at the intersection.
Point F is on one of the curves but not at the intersection.
The equilibrium point is Point A (Option 3).
Point A represents where the demand and supply curves meet, which is the definition of market equilibrium.
Related questions:
2025: 30 May Shift 1
2025: 22 May Shift 1
2025: 19 May Shift 1