Skip to main contentSkip to solution

Analyze the given data for exports and imports of rubber in Rs. crores from 2006 to 2017 and answer the questions based on the analysis.
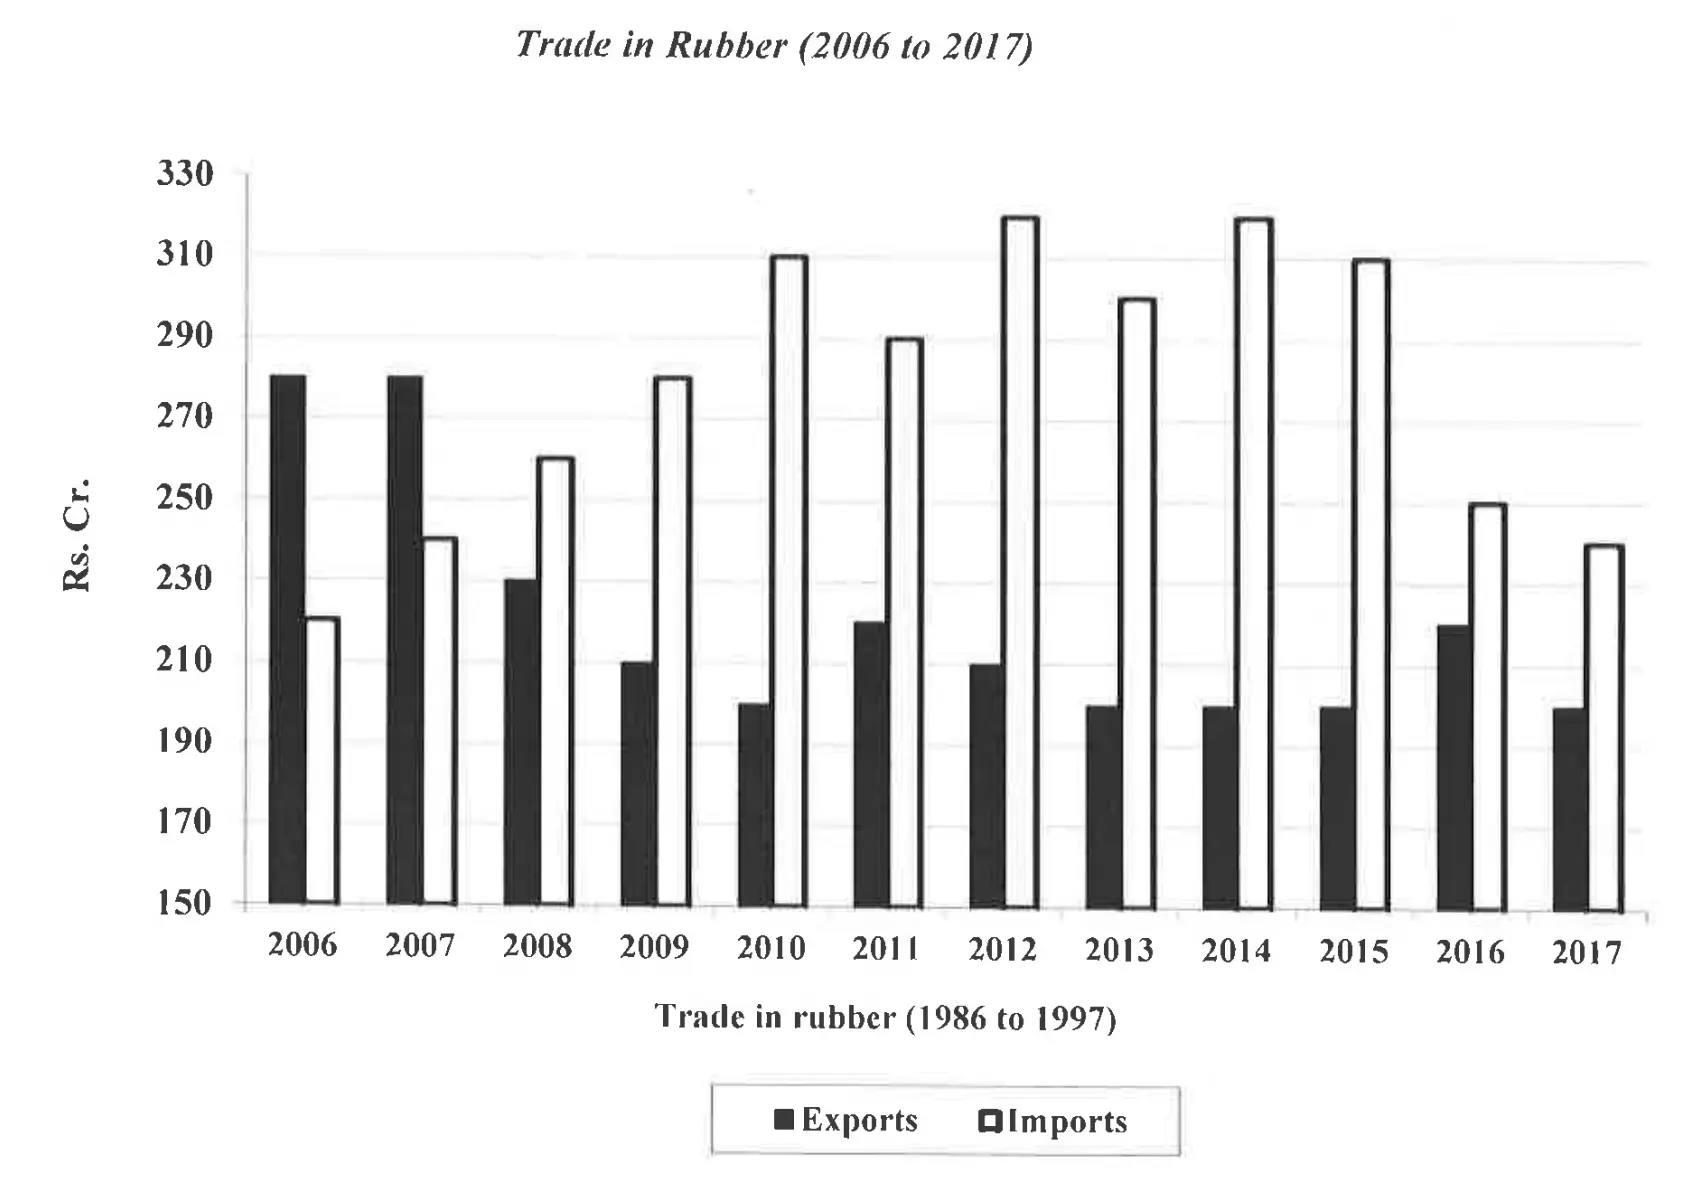
Figure for IPMAT Indore 2019 MCQ question 40 (Data Interpretation)

The percentage increase in imports over the previous year is maximum during

Solution

✅ Correct Option: 1

The percentage increase in imports for each given option using the formula: New Value - Original ValueOriginal Value×100\frac{\text{New Value - Original Value}}{\text{Original Value}} \times 100

2009 to 2010:

Imports 2009: 280280

Imports 2010: 310310

Percentage increase = 310−280280×100=30280×100=10.71%\frac{310 - 280}{280} \times 100 = \frac{30}{280} \times 100 = 10.71\%

2010 to 2011:

Imports 2010: 310310

Imports 2011: 290290

This is a decrease: 290−310310×100=−6.45%\frac{290 - 310}{310} \times 100 = -6.45\%

2013 to 2014:

Imports 2013: 300300

Imports 2014: 320320

Percentage increase = 320−300300×100=20300×100=6.67%\frac{320 - 300}{300} \times 100 = \frac{20}{300} \times 100 = 6.67\%

2008 to 2009:

Imports 2008: 260260

Imports 2009: 280280

Percentage increase = 280−260260×100=20260×100=7.69%\frac{280 - 260}{260} \times 100 = \frac{20}{260} \times 100 = 7.69\%

Comparing all values, the maximum percentage increase was 10.71%10.71\% during 2009 to 2010, making this the correct answer.

Keyboard Shortcuts

  • Left arrow: Previous question
  • Right arrow: Next question
  • S key: Jump to solution
  • Q key: Jump to question