Skip to main contentSkip to solution

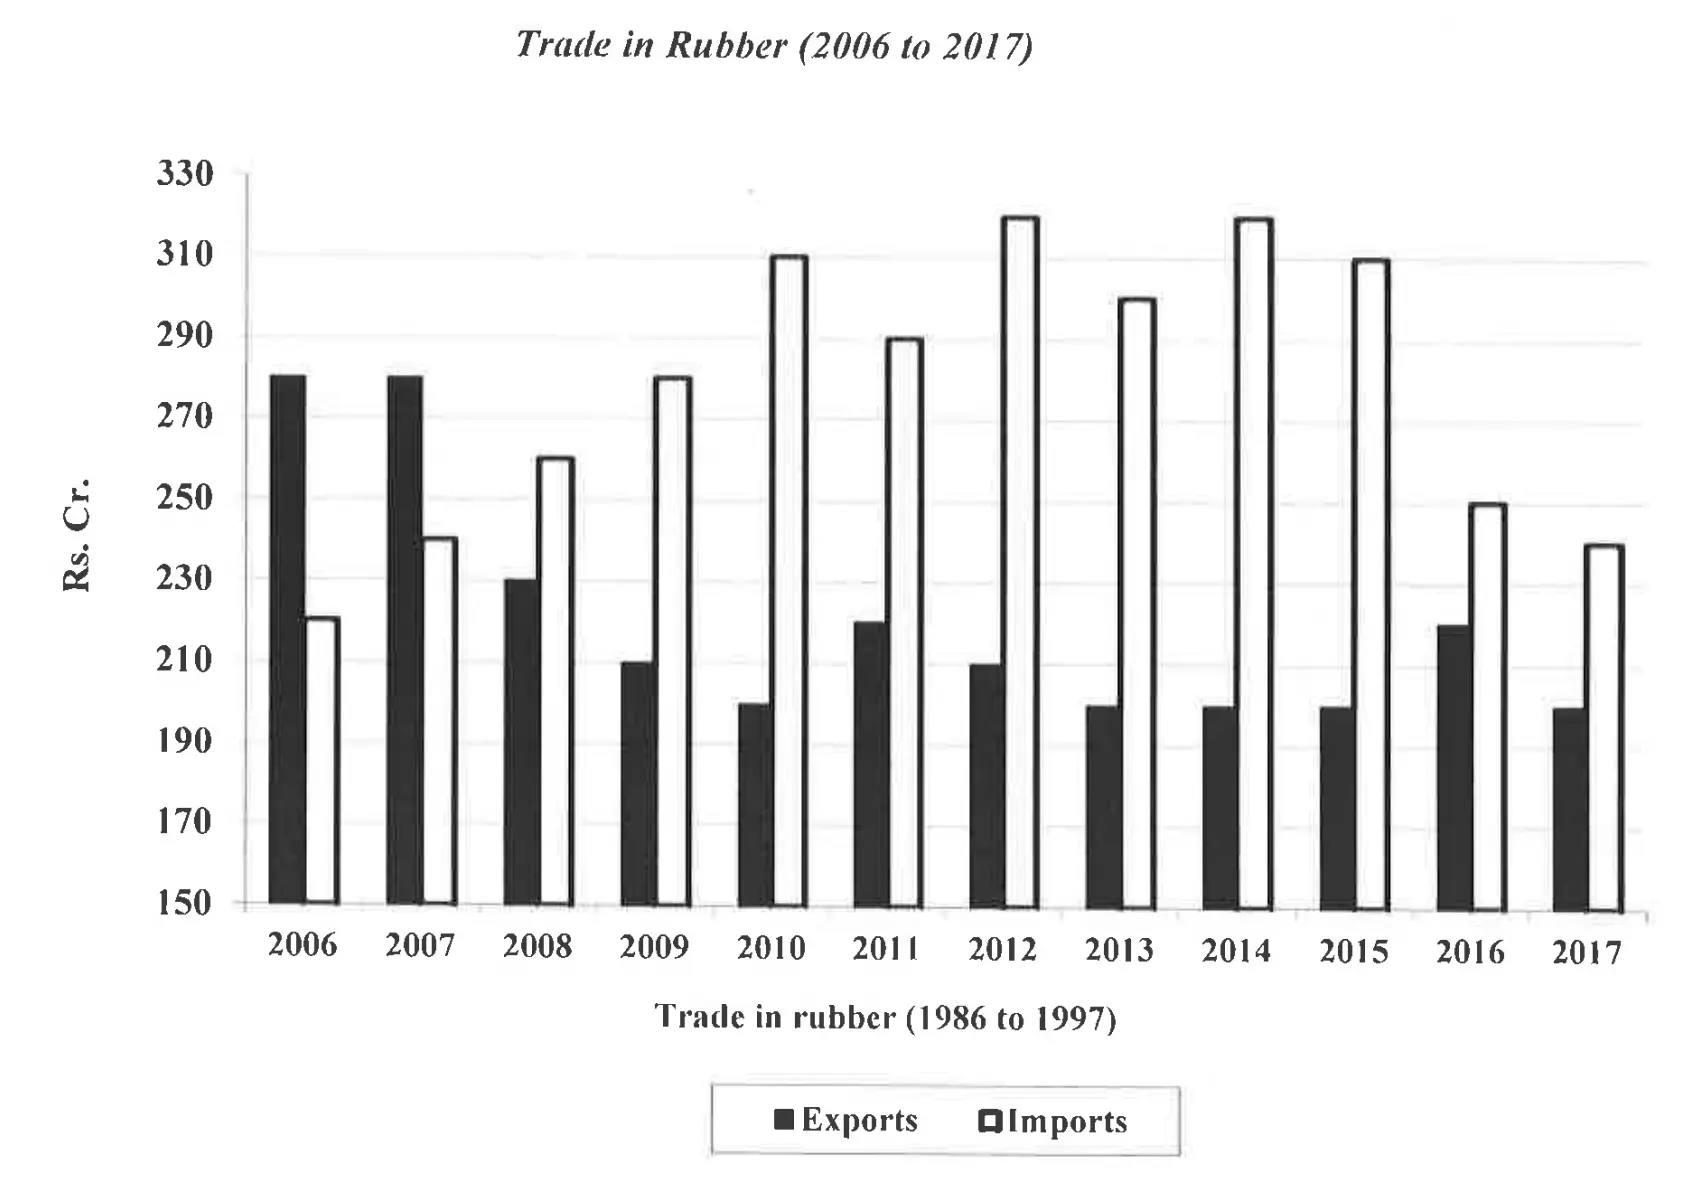
Analyze the given data for exports and imports of rubber in Rs. crores from 2006 to 2017 and answer the questions based on the analysis.

Figure for IPMAT Indore 2019 MCQ question 39 (Data Interpretation)

Balance of trade is defined as imports subtracted from exports ( = exports - imports). Which of the following blocks of three years has witnessed the largest average negative balance of trade?

Solution

✅ Correct Option: 4

For 2007-2009:

2007: 280−240=40280 - 240 = 40

2008: 230−260=−30230 - 260 = -30

2009: 210−280=−70210 - 280 = -70

Average = 40−30−703=−20\frac{40 - 30 - 70}{3} = -20

For 2015-2017:

2015: 200−310=−110200 - 310 = -110

2016: 220−250=−30220 - 250 = -30

2017: 200−240=−40200 - 240 = -40

Average = −110−30−403=−60\frac{-110 - 30 - 40}{3} = -60

For 2014-2016:

2014: 200−320=−120200 - 320 = -120

2015: 200−310=−110200 - 310 = -110

2016: 220−250=−30220 - 250 = -30

Average = −120−110−303=−86.67\frac{-120 - 110 - 30}{3} = -86.67

For 2010-2012:

2010: 200−310=−110200 - 310 = -110

2011: 220−290=−70220 - 290 = -70

2012: 210−320=−110210 - 320 = -110

Average = −110−70−1103=−96.67\frac{-110 - 70 - 110}{3} = -96.67

After comparing, the period 2010-2012 has the largest negative average balance of trade at −96.67-96.67 crores, making it the correct answer.

Keyboard Shortcuts

  • Left arrow: Previous question
  • Right arrow: Next question
  • S key: Jump to solution
  • Q key: Jump to question