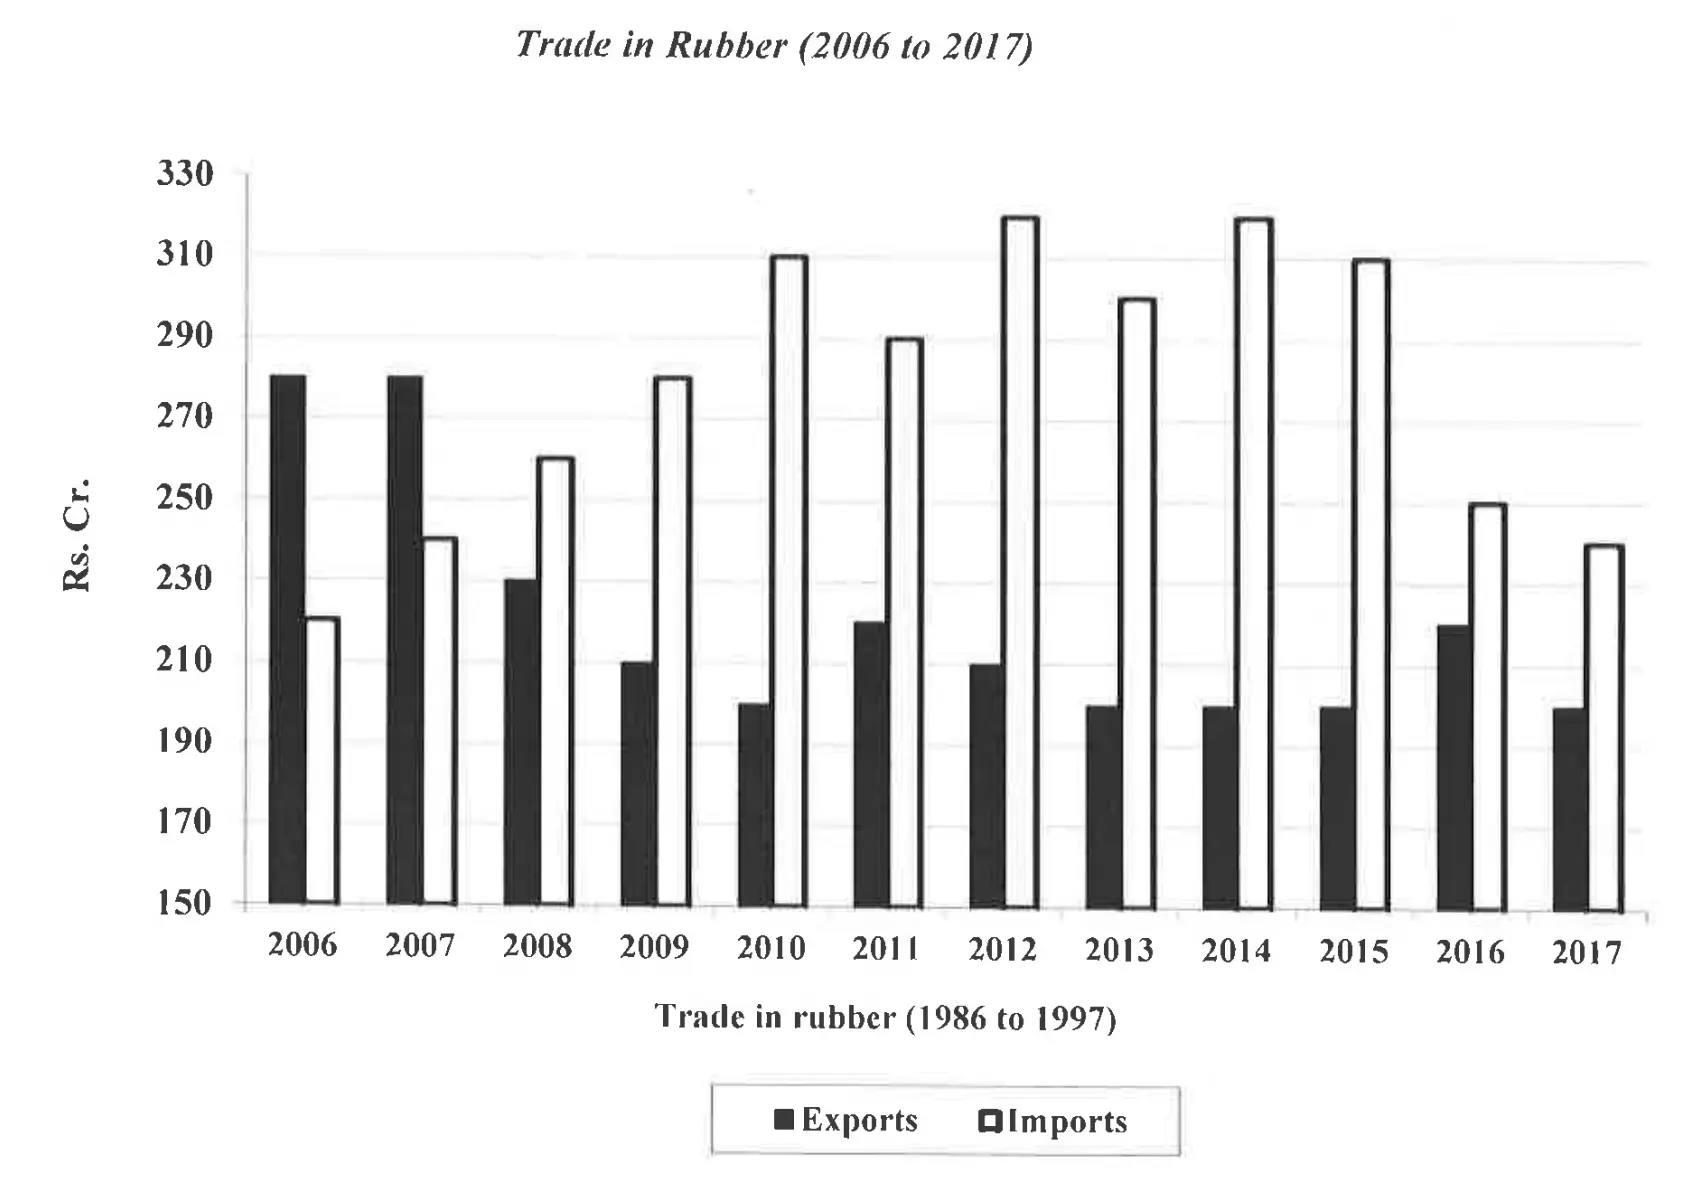
Data Interpretation past year questions, IPMAT Indore 2019 > Bar Graphs past year questions, Data Interpretation, IPMAT Indore 2019Easy36 of 40Analyze the given data for exports and imports of rubber in Rs. crores from 2006 to 2017 and answer the questions based on the analysis. Average annual exports for the given period 2006-2017 was approximatelyRs. 230 CrRs. 220 CrRs. 210 CrRs. 190 CrSolution✅ Correct Option: 2Average=Sum of annual exports across all yearsNumber of years\text{Average} = \dfrac{\text{Sum of annual exports across all years}}{\text{Number of years}}Average=Number of yearsSum of annual exports across all years =280+280+230+210+200+220+210+200+200+200+220+20012=\dfrac{280+280+230+210+200+220+210+200+200+200+220+200}{12}=12280+280+230+210+200+220+210+200+200+200+220+200 =265012≈220=\dfrac{2650}{12}\approx220=122650≈220 crores.Related questions:IPMAT Indore 2019The percentage decline in exports during the period 2006-2011 is more than the percentage decline in exports during 2012-2017 by approximatelyIPMAT Indore 2019The maximum difference between imports and exports isIPMAT Indore 2019Balance of trade is defined as imports subtracted from exports ( = exports - imports). Which of the following blocks of three years has witnessed the largest average negative balance of trade?IPMAT Indore 2019The percentage increase in imports over the previous year is maximum during